The True Cost of manual production planning in 2025
What does a single manual decision cost your factory over a year? Manual production planning still shapes choices on thousands of shop floors, yet the hidden price—in lost output, energy waste and avoidable downtime—is finally visible. The focus keyword "manual production planning" appears here because understanding its cost is the first step to change. This article unpacks concrete 2023–2025 statistics, real-world examples and pragmatic steps for Mittelstand manufacturers to quantify the true cost of manual planning and build a targeted digital pilot.
Why Manual Planning Fails
Manual planning depends on spreadsheets, shift boards and experienced staff memories. That reliance creates rigidity: planners cannot react quickly to machine derates, late orders or worker absences. The result is frequent firefighting rather than proactive optimization, and firefighting is expensive.
Research shows unplanned downtime drives the largest portion of cost. ABB’s survey and Siemens’ industry analysis in 2023–2024 report that unplanned outages can cost manufacturers roughly $100k–$125k per hour in many sectors. For an SME, the absolute number is smaller, but the relative impact is larger—losing a single productive hour can erase a week’s worth of margin on critical orders.
Manual production planning also creates hidden friction in continuous improvement. When planners are tied to daily rescheduling, they have little bandwidth to analyze root causes or run experiments that improve throughput. This human bandwidth constraint is often the real limit to improvement, not machine capability.
The Real Impact
Start with visibility: manual planning lacks minute-level machine data. A small throughput drop of 5–10% on a bottleneck machine is easy to miss without sensors. Over months that slide erodes capacity and forces higher inventory buffers to hit delivery dates.
Concrete figures matter. Siemens’ "True Cost of Downtime" (2024) models that unplanned downtime cost the global manufacturing sector hundreds of billions annually, while Fortune 500 firms reported downtime equating to around 11% of turnover in related studies. For a Mittelstand firm with €20M revenue, a conservative 1% revenue erosion from planning flaws equals €200k per year—money that could fund new equipment or a digital pilot.
Beyond revenue, manual approaches increase changeovers and micro-stops. These small events accumulate: ten daily micro-stops of five minutes each equal nearly an hour of lost production per day. Over a year, that adds up to significant capacity loss and unpredictable lead times.
1. Hidden Cost: Time Waste
Time shows up three ways: planning time, wait time and recovery time. Planners spend 20–40% of their week updating schedules according to surveys of European SMEs. That is skilled time used for tactical tasks rather than strategic improvements.
Wait time happens when materials, tools or operators are not synchronized with the manual schedule. Recovery time is the visible cost: overtime, expedited shipping and rework after missed deadlines. Each has a dollar figure—salary, expedited transport and scrap rates—that compounds.
Example: Handover Delays
A German subcontractor managed shift changes with paper lists and verbal notes. Night teams often found missing tool sets and incomplete fixtures. Average setup delays were 25–35 minutes per machine, equating to roughly 8% effective downtime. After deploying retrofit sensors to track machine states and a simple digital board, setup delays fell to 10–12 minutes, recovering nearly a full machine-day of capacity per week.
That recovered time funded a pilot to optimize sequencing, demonstrating how reclaiming planner hours and machine runtime creates room to improve processes rather than just fixing daily problems.
2. Hidden Cost: Poor OEE
OEE combines availability, performance and quality. Manual planning tends to suppress all three because it misses gradual throughput declines and causes poor sequencing that increases scrap or micro-stops. Many mixed-product lines still report OEE around 30% when planning stays manual and visibility is limited.
Case studies show that sensor retrofits and analytics frequently lift OEE into the 50–60% range within months. Doubling OEE from 30% to 60% does not require new machines—just better data and targeted actions. For a plant running at 30% OEE on a €15M revenues base, improving to 60% can unlock millions in theoretical capacity and margin.
Manual production planning impact
Manual production planning blunts OEE gains because it cannot prioritize interventions that yield the best return. Planners often react to visible failures and not to slow performance degradations. That means maintenance is scheduled around convenience rather than criticality, and sequencing ignores hidden quality drivers.
Case Study: OEE Lift
A medium-sized metal shop installed low-cost AVA sensor modules and an analytics layer. Within six months OEE rose from ~30% to ~60% by eliminating recurring micro-stops and optimizing changeover timing. This matched observed results for several retrofitting projects and delivered measurable extra throughput without capital expenditure.
Key to success was not just data but codified responses: short standard work instructions, prioritized maintenance tasks, and weekly reviews. Those behaviours turned raw signals into durable OEE gains.
3. Hidden Cost: Energy Waste
Energy is no longer a secondary cost. After the energy price shocks of 2022–2024, energy efficiency and scheduling have direct financial and regulatory importance. Industry research in 2024–2025 connects digital adoption to measurable energy savings: aligning production sequencing and clustering energy-heavy operations reduces peak demand and idle consumption.
Practical gains are tangible. In a foundry scenario, grouping similar heat-intensive batches reduced cumulative furnace warm-ups, cutting gas consumption by an estimated 5–12% depending on batch variability. For manufacturers exposed to time-of-use tariffs, shifting high loads to off-peak windows reduces both cost and carbon footprint.
To put numbers on it: a small plant paying €0.25/kWh that reduces peak electricity use by 10% across a baseline annual usage of 1,000,000 kWh saves roughly €25k per year. For gas-heavy operations the savings scale similarly with reduced warm-ups and standby losses. These savings compound across multiple lines and provide quick payback on modest retrofit investments.
Practical Actions
- Meter machine-level energy with inexpensive clamps or retrofitted modules.
- Use historical analytics to find high-energy micro-events tied to planning choices.
- Batch high-energy jobs to reduce cumulative warm-ups.
Tackling Bottlenecks
Bottlenecks emerge slowly under manual planning. A 7% drop on one line gradually forces workarounds across the plant: extra inventory, priority swaps and hidden overtime. Digital monitoring reveals trends weeks earlier than manual reports, giving planners time to intervene before a full stop.
Action is practical: reassign one maintenance resource during a low-impact shift to fix a recurring spindle overheating event. The cost is low, and throughput gains are immediate. Prioritization should follow a simple ROI rule: fix the issue with the highest throughput gain per euro invested.
Blindspots to Watch
- Small throughput losses (<10%) across many machines.
- Frequent, low-duration micro-stops that add up.
- Energy spikes tied to poor sequencing.
How to Start
Begin with a focused pilot. Choose a line that is representative, has a known bottleneck and where medium-impact fixes are implementable within weeks. Measure baseline OEE, changeover time and energy usage for four weeks and set a 12-week improvement target tied to euros saved.
Key pilot steps: install retrofits, configure a simple dashboard for shifts, run daily short reviews and collect root-cause actions. Use a conservative business case: if pilot increases OEE by 10 percentage points on a €3M line, that converts directly to capacity worth tens of thousands of euros per year.
Pilot checklist
- Baseline metrics: OEE, energy and changeover time.
- Low-friction retrofits: sensors plus simple dashboards.
- Short cadences: daily shifts, weekly reviews.
- Clear success criteria: euros recovered or percent OEE gain.
Scaling is iterative: replicate the pilot on the next highest-impact line and use the ROI from the first pilot to fund the second. This staged approach reduces risk and builds internal momentum, turning a pilot into a plant-wide program in 12–24 months.
The Path Forward
Manual production planning remains usable for stable, low-variance operations. For most SMEs, however, the cumulative cost of time waste, poor OEE and energy waste exceeds the investment needed for modest digital pilots. The right approach is pragmatic: pilot one line, measure baseline OEE and energy for 4 weeks, deploy retrofits and analytics, and measure the delta over the next 8–12 weeks.
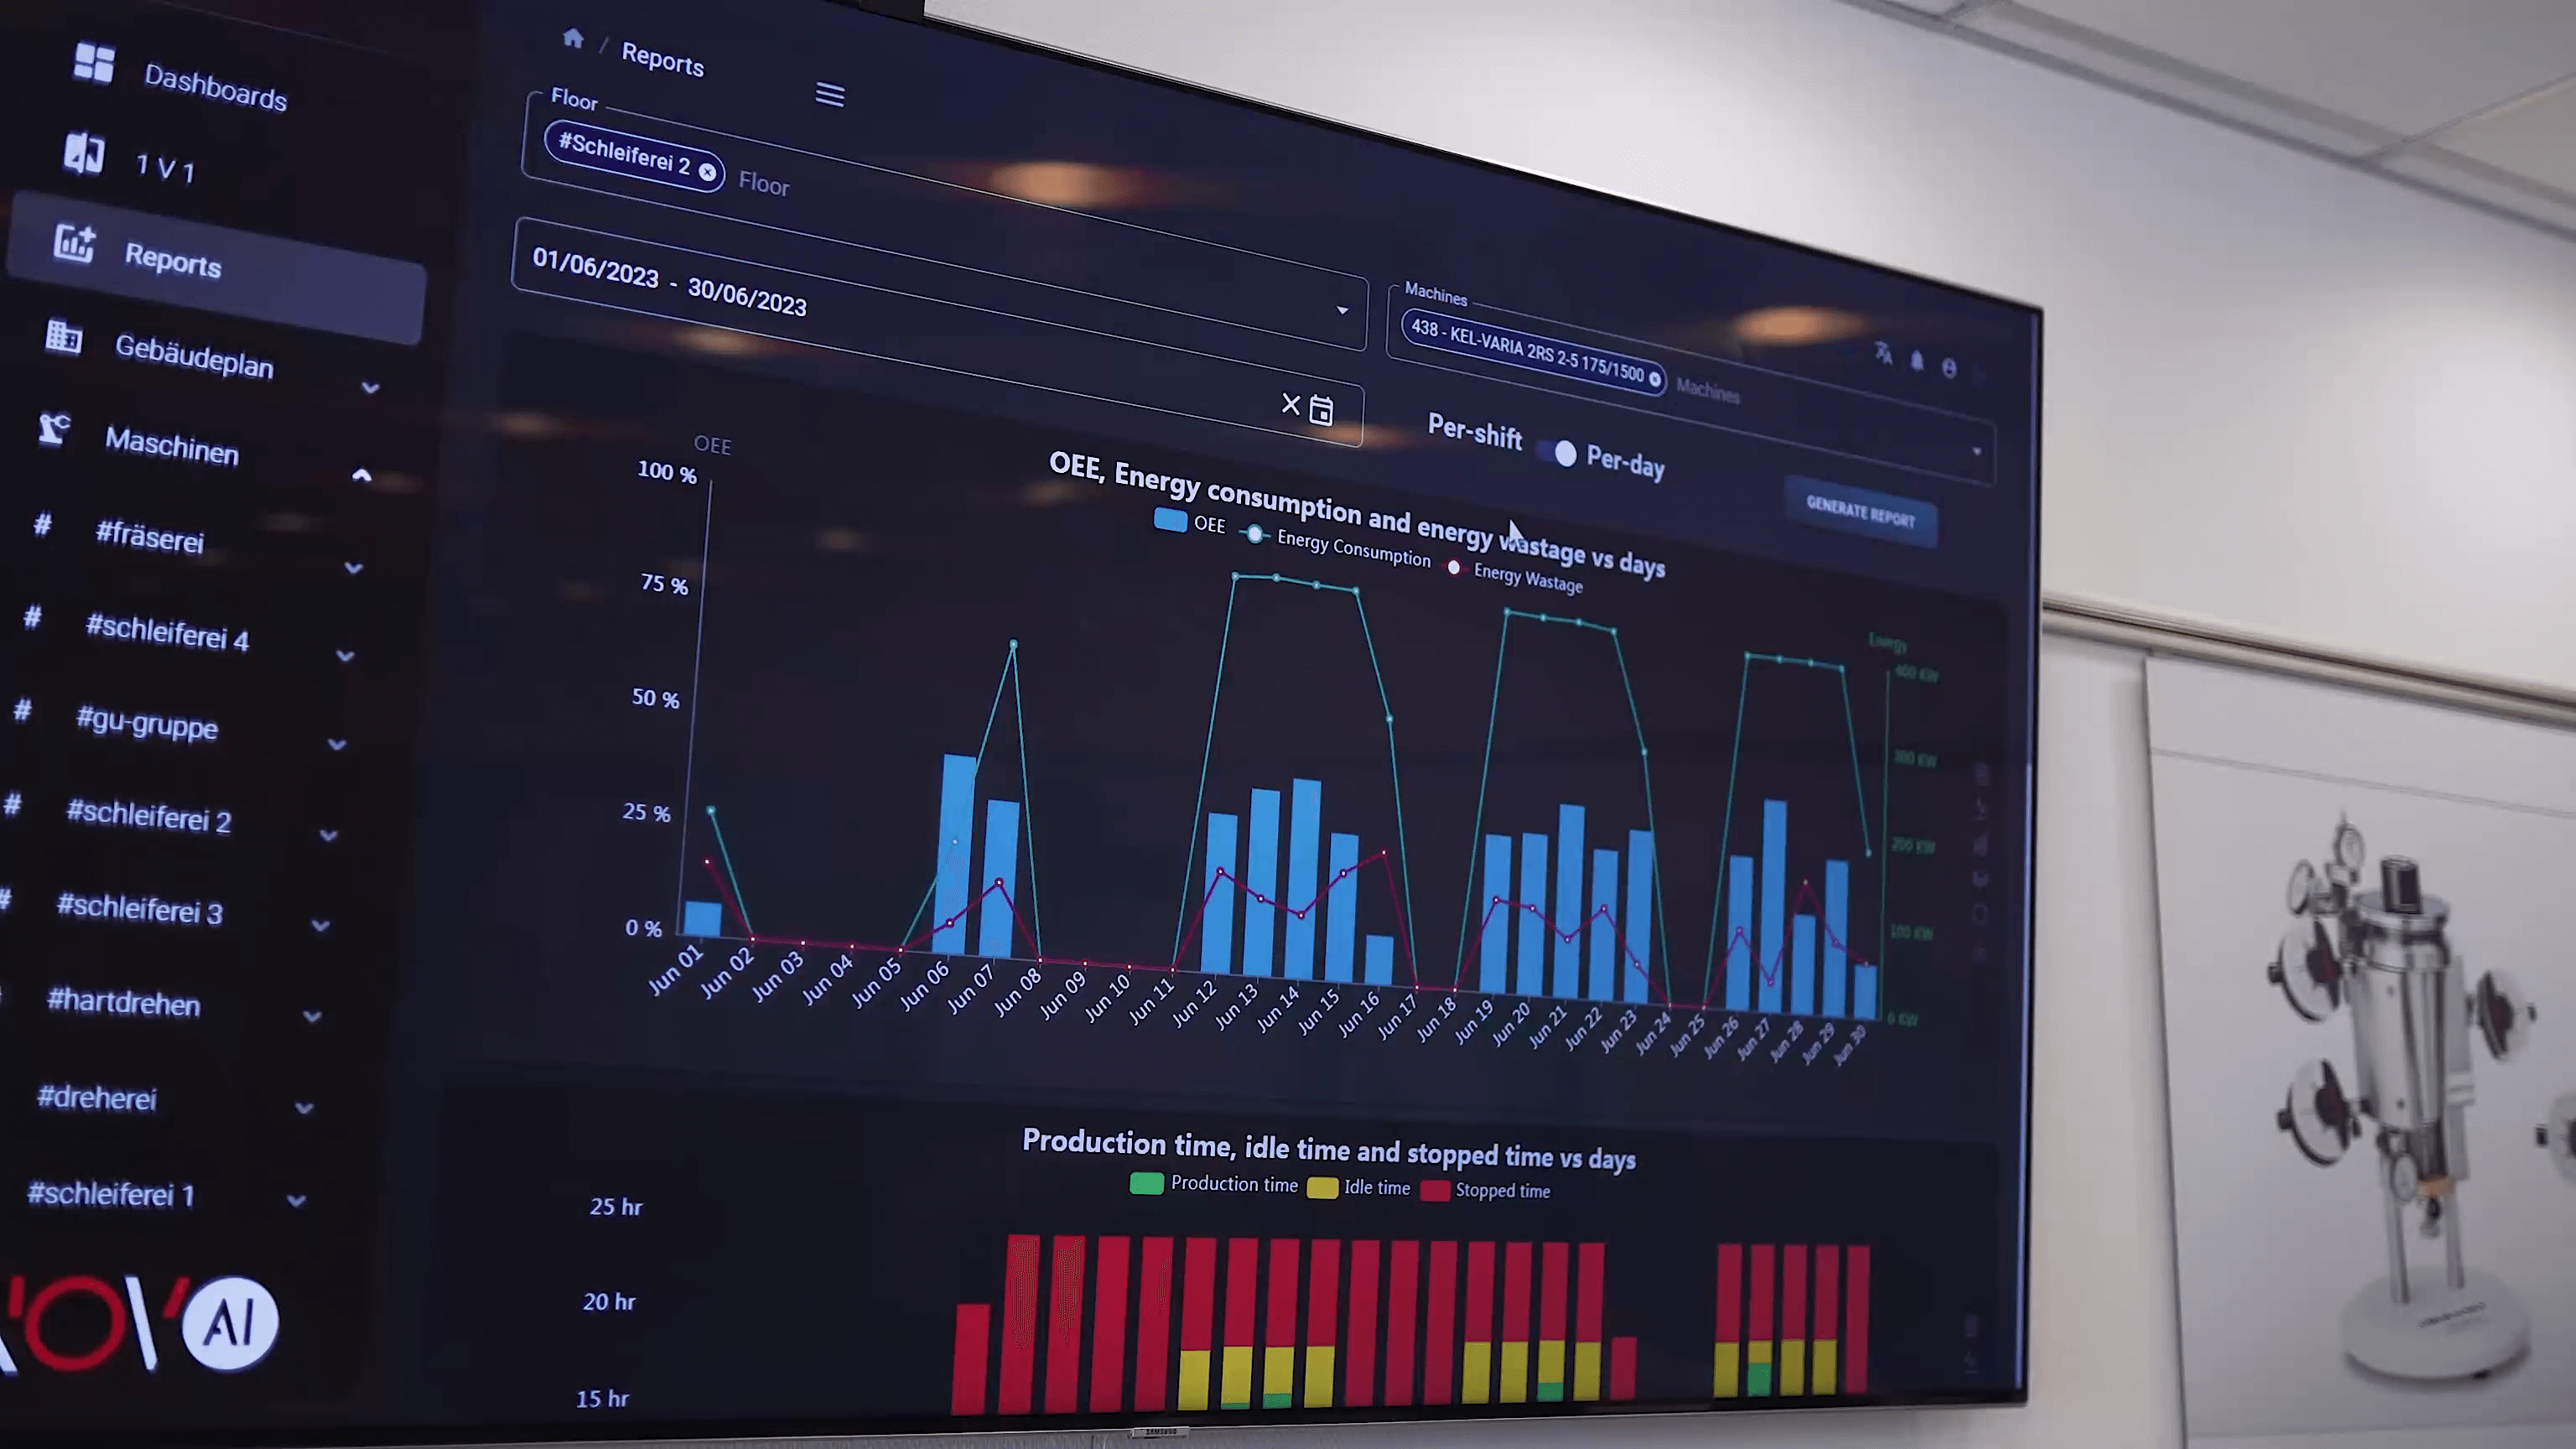
Modern solutions like Novo AI's WatchMen platform combine machine-agnostic retrofitting, secure local analytics, and simple dashboards to let planners act on live data without disrupting operations.
Start with measurable goals: reduce changeover time by X minutes, cut micro-stops by Y events a day, or lower peak energy by Z percent. These metrics translate directly to euros and support scaling the solution across the plant. Small investments in sensors and analytics often pay back within months through recovered capacity and lower energy bills.
References
- ABB - "Value of Reliability" survey - Downtime costs and survey data (accessed: 2025-10-09)
- Siemens - The True Cost of Downtime 2024 - Industry analysis and models (accessed: 2025-10-09)
- Deloitte - Manufacturing Industry Outlook 2025 - Digital adoption trends (accessed: 2025-10-09)
- ScienceDirect - Energy management and Industry 4.0 (2025) - Research on energy efficiency and digitalization (accessed: 2025-10-09)