Home / Case Studies / Industrial Equipment
CASE STUDY / INDUSTRIAL EQUIPMENT MANUFACTURING
CNC Monitoring in Industrial Equipment Manufacturing
How can a large CNC fleet turn hidden time losses into productive capacity? Across 125 turning and milling machines operating in three shifts, WatchMen made idle time, microstops, setup losses and downtime visible. The customer reported 27% higher productivity.
Free PDF · No registration

CNC manufacturing of precision components for industrial coding and marking equipment.
+27%
higher productivity
Reported customer result
125
CNC machines
Turning and milling
+121,500 h
productive capacity
Calculated annual gain
In this case study Project · Implementation · Measures · Results · FAQ
THE PROJECT
At a Glance
Industry
Industrial equipment manufacturing
Machine fleet
125 CNC machines · Built 1999–2026
Operations
Three shifts
Application
Turning and milling
Technology
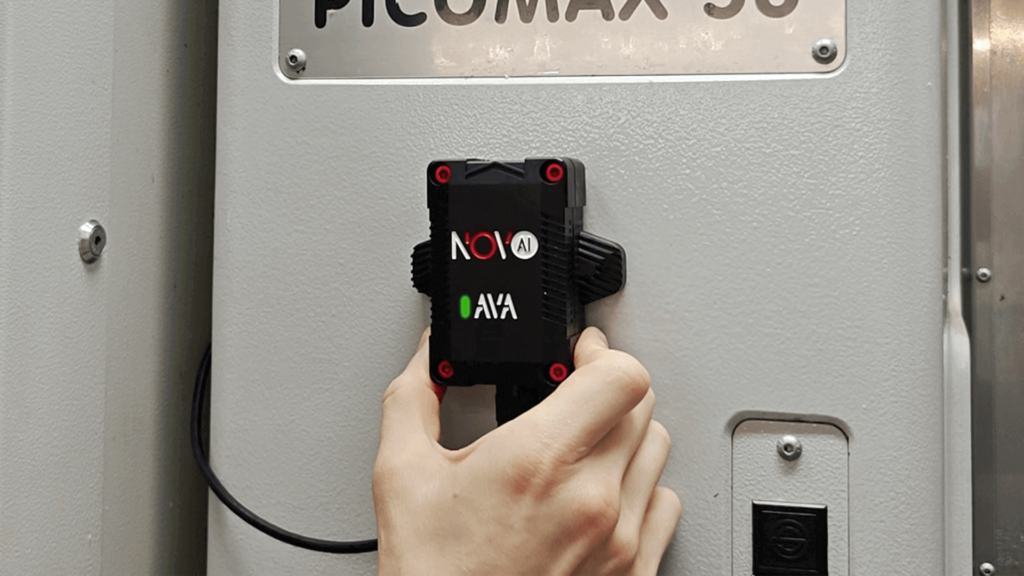
Novo AI retrofit sensors + WatchMen
Focus
Idle time, microstops, setup losses, downtime and OEE
THE CHALLENGE
Small losses accumulated across a large CNC fleet.
Waiting for material, tools, approvals or the next order, recurring short stops and delayed alarm responses reduced productive time across all three shifts. The challenge was to make these losses visible, quantify their impact and convert the findings into practical improvements.
Idle Time
Identify waiting for material, tools, approvals and the next order.
Microstops & Downtime
Reveal recurring short interruptions and delayed responses to alarms.
Shift Performance
Compare productive share and released capacity across all three shifts.
FROM MACHINE TO ANALYSIS
Measure. Investigate. Improve.
Machine-state data showed when capacity was being lost. Production context helped the team understand why, compare the three shifts and verify whether operational changes improved performance.
01
Capture machine states
WatchMen captured productive time, idle time, microstops, setup losses and downtime across 125 turning and milling machines.
02
Compare three shifts
The team compared productive share and time losses by shift, making recurring patterns and differences visible at fleet level.
03
Verify improvements
Before-and-after calculations translated operational changes into productive hours, released capacity and an OEE sensitivity view.
MACHINE ACTIVITY
Machine Activity Over Time
WatchMen distinguishes productive operation from idle time, microstops, setup losses and downtime. Combined with production context, this timeline reveals where capacity is lost and which causes should be addressed first.
TURNING DATA INTO ACTION
What the Team Changed in Daily Operations
The monitoring data identified the largest sources of lost time. The production team used these findings to prepare work earlier, reduce recurring interruptions and strengthen response routines.
01
Prepare the next job earlier
Materials, tools, approvals and the next order were prepared earlier. The calculation attributes 60,000 released hours per year to lower idle time.
02
Reduce recurring losses
Recurring microstops and setup or handover losses were investigated and reduced. Together, these areas account for 33,750 hours of calculated annual capacity gain.
03
Clarify alarm ownership and planning
Clear alarm ownership shortened response time, while machine reality informed planning. The same workload was calculated to fall from 20.00 to 15.75 hours.
RESULTS IN CONTEXT
What Improved During the Project
CALCULATED PRODUCTIVE SHARE
60.0% → 76.2%
Before · 60.0%
After · 76.2%
Scale: 0–100% of scheduled time · An increase of 16.2 percentage points.
+121,500
additional productive machine-hours per year
Calculated annual capacity gain across the fleet of 125 CNC machines.
Before and after: Calculated productive time increased from 450,000 to 571,500 hours per year. Idle time fell from 135,000 to 75,000 hours, a reduction of 44.44%, while the customer reported 27% higher productivity.
View the measurement basis in the PDF ↓Context: The 27% productivity increase is the customer-reported result. The detailed time and OEE figures are calculations based on the case-study worksheet and a scheduled annual time of 750,000 machine-hours.
GOOD TO KNOW
Questions About CNC Monitoring
Which machines were included in the case study?
The project covered 125 CNC turning and milling machines used to manufacture precision components for industrial coding and marking equipment. The machines were built between 1999 and 2026.
What productivity result did the customer report?
The customer reported a 27% increase in productivity after using WatchMen and implementing the associated operational improvements.
How much idle time was reduced?
Calculated idle time per machine per eight-hour shift fell from 86.4 to 48.0 minutes. Across the fleet, annual idle time fell from 135,000 to 75,000 hours, releasing 60,000 hours.
How did performance change across the three shifts?
The calculated productive share rose from 62.00% to 78.74% in shift 1, from 60.00% to 76.20% in shift 2 and from 58.00% to 73.66% in shift 3.
How was the OEE sensitivity calculated?
The calculation held performance at 90% and quality at 98%, while availability followed the productive share. On that basis, calculated OEE increased from 52.92% to 67.21%, a gain of 14.29 percentage points.
How was the annual capacity calculated?
The worksheet assumes 125 machines, three shifts, eight hours per shift and 250 operating days, equal to 750,000 scheduled machine-hours per year. The calculated productive share then rises from 60.00% to 76.20%.
THE COMPLETE CASE STUDY
Details to Support Your Decision
Download the English PDF with the full project description, calculation basis and results.
Download the free PDF ↓APPLYING IT TO YOUR PRODUCTION
What Would You Like to Make Visible?
Tell us the number and years of manufacture of your CNC machines, your shift model and your most important concern: idle time, microstops, setup losses, downtime or OEE.
Discuss your application →Further reading: CNC Monitoring in Precision Tool Manufacturing · Stretching Machine Monitoring · All case studies · CNC machine data acquisition and retrofit
Publisher: Novo AI GmbH. Source of the project information: the English case-study PDF. The productivity increase is customer-reported; the detailed time and OEE values are calculated from the worksheet assumptions.
External references: OEE.com: OEE definition and calculation · OEE.com: Six Big Losses in manufacturing. These references explain the general methodology and loss categories; the customer results and model assumptions come from the case-study PDF.