Home / Case Studies / Laser Cutting Machine
CASE STUDY / PIPEWORK MANUFACTURING
Laser Cutting Monitoring in Pipework Manufacturing
How can pipework manufacturers make hidden production losses visible around an existing laser-cutting process? In this project, Novo AI WatchMen was used within a 57-machine production environment with equipment generations spanning 2008 to 2020. The supplied project result reports a 30.4% productivity improvement, while machine-state data helped make idle time, setup, loading, program-related waiting, microstops and downtime visible
Free PDF · No registration
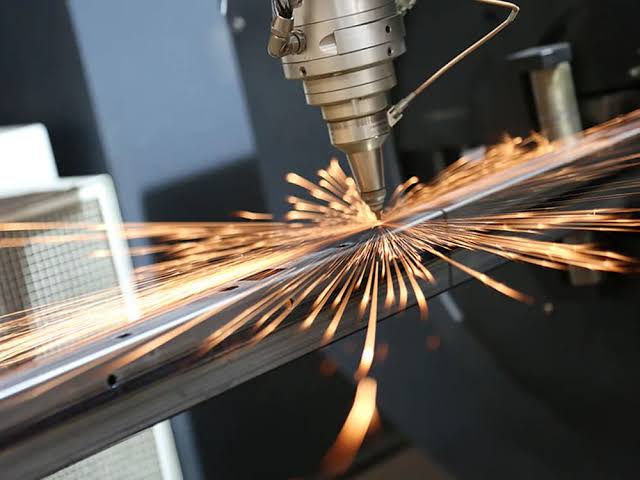
Laser cutting in pipework manufacturing: making productive processing.
+30.4%
higher productivity
Customer-reported result
57
production machines
Wider production environment
+10,522.8 h
productive capacity per year
Approximate modeled fleet estimate
In this case study Project · Implementation · Measures · Results · FAQ
THE PROJECT
At a Glance
Industry
Pipework manufacturing
Machine fleet
57 production machines; Built 2008–2020
Application
Fibre-laser cutting
Operations
Operating model: 2 × 8-hour shifts
Technology
External Novo AI retrofit sensors + WatchMen
Focus
Productive cutting, idle time, setup, loading, program-related waiting, microstops and downtime
THE CHALLENGE
A Running Laser Can Still Hide Lost Productive Capacity
Laser processing can remain active around loading, positioning, setup, program checks and material handling even when value-creating cutting is not taking place.
In high-mix pipework manufacturing, frequent order transitions can magnify these losses. The challenge was therefore to distinguish productive laser processing from the time consumed by setup, loading, waiting, short interruptions and downtime.
Productive Cutting
Identify whether scheduled machine time is actually being used for value-creating laser processing.
Setup & Loading
Make setup, order changes, positioning and material-loading losses visible and consistently comparable.
Interruptions & Downtime
Reveal recurring microstops, program-related waiting and longer technical stops.
FROM MACHINE TO ANALYSIS
Capture. Validate. Understand.
Monitoring provides the physical machine timeline. Useful laser-process analysis comes from validated machine states combined with order, program, material and production context.
01
Capture machine behavior
External Novo AI sensors create a common machine-state layer on existing laser equipment without requiring PLC or machine-control intervention for the basic monitoring layer.
02
Validate machine states
Edge processing and validation support the distinction between productive cutting, idle periods, setup activity, recurring interruptions and downtime.
03
Add production context
WatchMen links machine states with order and production information. Material, thickness, geometry, nesting, program, batch size, loading method and quality requirements can then be considered when investigating deviations.
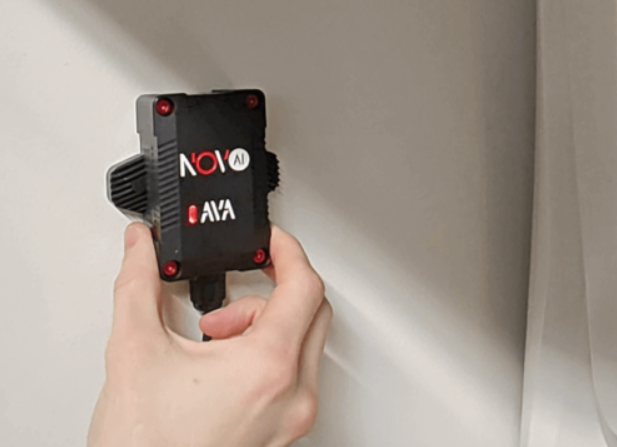
EXTERNAL SENSORS
Laser Cutting Data Without PLC Access
External retrofit sensors capture physical machine behavior without requiring direct intervention in the laser control system for the basic monitoring layer.
WatchMen turns validated signals into a machine-state timeline. This makes productive cutting, idle periods, setup activity and recurring interruptions visible over time.
Order, program, material, loading, quality and maintenance context then help explain why a particular loss occurred.
TURNING DATA INTO ACTION
Turn Recurring Laser Losses Into Practical Improvements
Monitoring provides the machine evidence. The production team can then focus on the largest recurring losses and verify whether operational changes release usable laser capacity.
01
Reduce hidden idle time
Review longer waiting periods around next-order preparation, material staging and machine readiness. Recurring idle patterns help identify where preparation and response need to improve before productive cutting can continue.
02
Improve setup and loading readiness
Prepare programs, materials and setup tasks before the laser becomes available. Coordinate material staging and loading so that a technically available laser does not wait unnecessarily for the next production step.
03
Reduce recurring interruptions and downtime
Separate repeated microstops from longer technical faults and program-related waiting. Combine the machine timeline with production and maintenance context, implement corrective actions and then compare the same indicators again.
RESULTS IN CONTEXT
What Improved During the Project
REPORTED PROJECT RESULT
−36.54%
less idle time
In the modeled production scenario, idle time was reduced by 36.54%. Detailed before-and-after values and the calculation basis are included in the complete case study PDF.
+608
additional productive machine-hours per year
Approximate annual capacity estimate for the modeled laser system.
Supplied project result: The project data reports a 30.4% productivity improvement. WatchMen helped make productive laser processing and recurring losses such as idle time, setup, material/loading waiting, microstops, downtime and program-related waiting visible for systematic investigation.
Annual capacity estimate: The modeled improvement corresponds to approximately 608 additional productive machine-hours per year on the modeled laser system. This represents released laser capacity within the existing machine schedule rather than a full year of directly measured additional output.
Context: These figures relate to the project described. Starting conditions, product mix, shift model and the measures implemented affect the result. A reduction in time losses does not automatically mean an equally large increase in OEE.
GOOD TO KNOW
Questions About Laser Cutting Monitoring in Pipework Manufacturing
What was the scope of the project?
The wider production environment includes 57 machines with machine generations spanning 2008 to 2020. The detailed laser-capacity model is normalized to the monitored laser system rather than the complete 57-machine environment.
What productivity result was supplied?
The supplied project result reports a 30.4% productivity improvement. Detailed idle-time, setup, loading and annual-capacity figures are modeled values used to interpret that result.
How much idle time was reduced?
In the modeled production scenario, idle time was reduced by 36.54%. Detailed before-and-after values and the calculation basis are available in the complete case study PDF.
How much additional productive capacity was calculated?
The model estimates approximately 608 additional productive machine-hours per year for the modeled laser system. This is an annualized capacity estimate rather than a complete year of directly measured additional production.
What production losses can laser monitoring make visible?
The case study considers productive cutting, idle time, setup and changeovers, material/loading waiting, microstops, downtime and program-related waiting.
Can existing laser machines be monitored without PLC access?
The external Novo AI sensor approach provides a basic machine-state monitoring layer without requiring PLC or machine-control intervention.
THE COMPLETE CASE STUDY
Details to Support Your Decision
Download the English PDF with the project description, loss categories, results and detailed measurement and calculation basis.
Download the free PDF ↓APPLYING IT TO YOUR PRODUCTION
What Would You Like to Make Visible?
Tell us how many laser cutting systems you operate, their approximate years of manufacture and your most important production question: productive cutting, idle time, setup, material loading, program-related waiting, microstops or downtime?
Together, we can identify a suitable pilot and determine which machine states and recurring production losses should be made visible first.
Further reading: CNC Monitoring in Precision Tool Manufacturing · Understanding machine data acquisition: data and system boundaries · All Case Studies
Publisher: Novo AI GmbH. Source of the project information: the corresponding case study PDF. Definition and calculation: OEE based on availability, performance and quality.