Home / Case Studies / CNC and Sheet Metal
CASE STUDY / PRECISION CONTRACT MANUFACTURING
CNC and Sheet Metal Monitoring
How can a mixed machine fleet turn hidden waiting into productive capacity? A precision contract manufacturer used Novo AI WatchMen across 20 production machines and reported 30% higher productivity. AVA sensors and machine-state timelines connect what happens at the machine with daily production decisions.
Free PDF · No registration
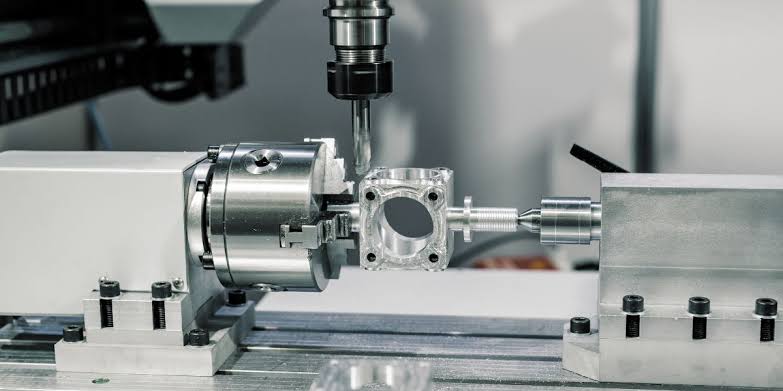
Representative CNC machining photograph. The case study covers a mixed CNC and sheet-metal production fleet.
+30%
higher productivity
Customer-reported result
20
production machines
Mixed fleet · Three shifts
+21,600 h
productive capacity
Calculated annual fleet gain
In this case study Project · Implementation · Measures · Results · FAQ
THE PROJECT
At a Glance
Industry
Precision contract manufacturing
Machine fleet
20 production machines · Built 2005–2026
Operations
Three shifts
Application
Turning, milling, cutting, bending and joining
Technology
External AVA sensors + WatchMen
Focus
Waiting, recurring interruptions, setup readiness and shift performance
THE CHALLENGE
The job was recorded. The waiting was harder to see.
The manufacturer already used digital work information and recorded setup and part times. But components move through turning, milling, cutting, bending and joining. Those records alone did not explain every gap between operations. The next machine also needs the right material, program, tooling and release.
Waiting Between Jobs
Locate idle periods between operations and review material, tooling, programs and approvals.
Recurring Interruptions
Review short stops as patterns across machines, operations and products.
Shift Readiness
Compare equivalent work with product mix, handovers and necessary process steps in view.
FROM MACHINE TO ANALYSIS
Sense. Interpret. Add Context.
Novo AI combines external AVA sensing with WatchMen to bring machines from different generations into one monitoring view, without relying on access to each machine’s PLC.
01
Sense machine activity
AVA sensors capture physical operating signals such as vibration and acoustics. External sensing adds visibility across the existing fleet built between 2005 and 2026.
02
Interpret machine states
WatchMen distinguishes productive, idle and stopped periods. Compare the interpretation with actual production, setup and necessary handling to establish a useful baseline.
03
Add production context
Review the timeline alongside job information, recorded setup and part times, and shop-floor observations. Choose a recurring loss, agree on a response and compare the same measures after the change.
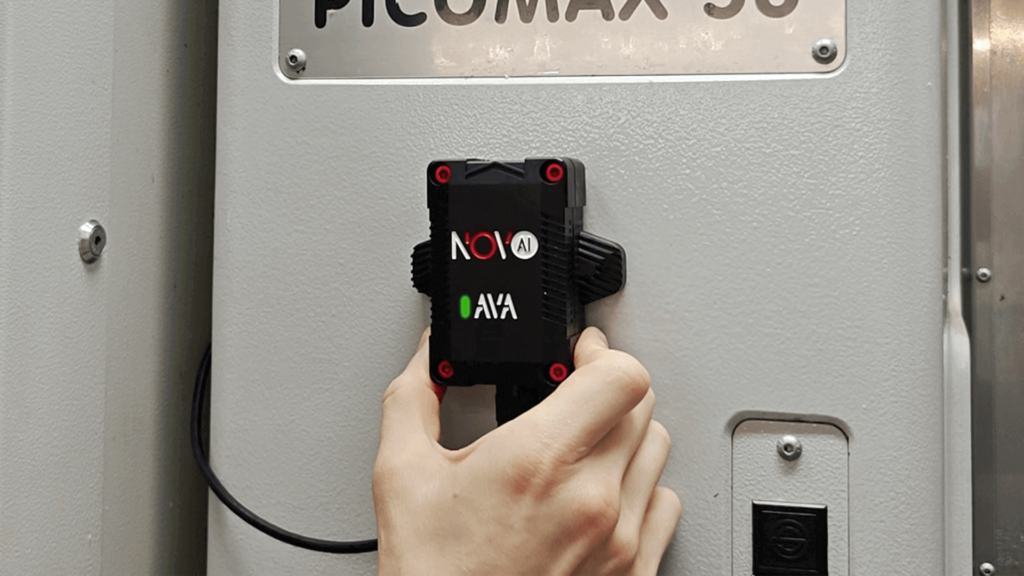
AVA + WATCHMEN
One Monitoring Layer Across the Existing Fleet
Machine states show when an interruption occurs. Orders, material readiness, operator input and setup requirements help explain why. Existing work records remain valuable; the additional physical machine timeline makes them easier to interpret.
More about retrofitting and capturing data from CNC machines →
TURNING DATA INTO ACTION
Turn a Recurring Loss into a Practical Response
Monitoring helps the team find where to investigate. Production improvements come from changing the routines behind the loss. The case study connects visibility to preparation, handovers and recurring interruptions.
01
Prepare the next job earlier
Review waiting between jobs and check whether material, programs, fixtures or approvals are missing. Prepare the next operation before the machine is ready and give unresolved readiness issues a clear owner.
02
Improve handovers and setup readiness
Use the timeline to review repeated losses around shift handovers. Check job readiness, material and outstanding issues. Compare setup records with machine activity, keeping necessary setup, handling and inspection distinct from avoidable delay.
03
Treat interruptions as a pattern
Group recurring events by machine, operation and product. Investigate causes, agree on a practical response and check whether interruptions decline under comparable conditions.
RESULTS IN CONTEXT
More Productive Use of the Same Fleet
CALCULATED PRODUCTIVE SHARE
60.0% → 78.0%
Before · 60.0%
After · 78.0%
Scale: 0–100% of scheduled time · An increase of 18 percentage points.
+21,600
additional productive machine-hours per year
Calculated annual capacity gain across 20 production machines.
Operating model: Productive time rises from 72,000 to 93,600 hours per year. Total nonproductive time falls from 48,000 to 26,400 hours, a 45% reduction. Idle time falls from 24,000 to 12,000 hours, contributing about 56% of the calculated capacity gain.
View the measurement basis in the PDF ↓Context: The customer-reported outcome is 30% higher productivity. Annual losses and shift changes are illustrative outputs of the supplied operating model, based on 120,000 scheduled hours with unchanged processing rate and quality. Released time and additional capacity describe the same gain and must not be added together. OEE is a separate calculation scenario.
GOOD TO KNOW
Questions About CNC and Sheet Metal Monitoring
Which machines and build years does the case study cover?
The case study covers a mixed fleet of 20 production machines built between 2005 and 2026, operating across three shifts. Components move through turning, milling, cutting, bending and joining.
What does Novo AI add to existing work records?
AVA sensors and WatchMen add a timeline of productive, idle and stopped periods. Reviewing it alongside digital work information, setup and part times helps the team locate waiting, investigate recurring losses and check the effect of changed routines.
Does monitoring require access to each machine’s PLC?
The Novo AI approach uses external AVA sensors to capture physical operating signals such as vibration and acoustics. It brings machines from different generations into a common monitoring view without relying on access to each machine’s PLC.
How do the three shifts compare?
In the supplied shift model, productive time per machine per eight-hour shift rises from 5.12 to 6.40 hours in shift 1, from 4.80 to 6.24 in shift 2 and from 4.48 to 6.08 in shift 3. Shift 3 has the largest calculated gain. Product mix, readiness and operating conditions need to be considered when comparing shifts.
Is the OEE improvement a measured result?
No. The separate OEE scenario uses a productive-time share of 60% and then 78% as the availability input, with performance fixed at 90% and quality at 98%. This gives 52.92% and 68.80%, a calculated increase of 15.88 percentage points. It is not a measured OEE result.
How is the annual capacity gain calculated?
The operating model assumes 20 machines × three shifts × eight hours × 250 days, equal to 120,000 scheduled machine-hours per year. A productive share rising from 60% to 78% gives 72,000 and 93,600 productive hours, a gain of 21,600 hours. Turning released time into useful output depends on ready work, material and downstream flow.
THE COMPLETE CASE STUDY
Details to Support Your Decision
Download the English PDF with the Novo AI implementation approach, practical response priorities, results and calculation assumptions.
Download the free PDF ↓APPLYING IT TO YOUR PRODUCTION
What Would You Like to Make Visible?
Tell us the size and build years of your mixed machine fleet, your production processes and shift model. Bring one recurring loss and the job context so we can discuss a focused WatchMen production review.
Discuss your application →Further reading: CNC Monitoring in Precision Tool Manufacturing · Stretching Machine Monitoring · All case studies · Retrofitting and capturing data from CNC machines
External references: OEE.com: OEE definition and calculation · OEE.com: Six Big Losses in manufacturing. These references explain the general methodology and loss categories. Customer results and calculation assumptions come from the case study.