Home / Case Studies / Expanded Metal
CASE STUDY / EXPANDED METAL MANUFACTURING
Stretching Machine Monitoring
How does monitoring make time losses in expanded metal manufacturing visible? In this project, the team used WatchMen to examine 15 stretching and cutting machines. After three months of operational improvements, the reported share of nonproductive time fell from 49.7% to 33.4%.
Free PDF · No registration
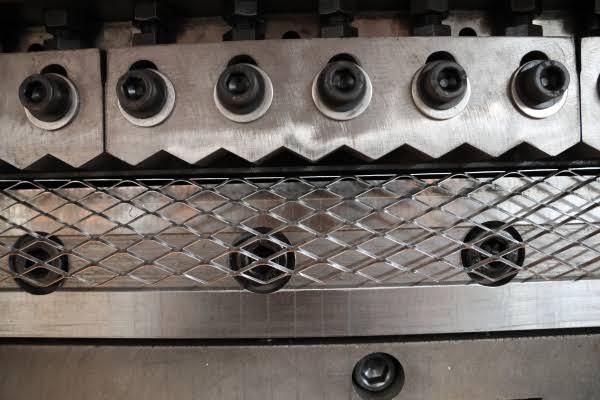
Expanded metal manufacturing: considering performance and product quality together.
32.8%
less nonproductive time
Relative reduction in the project
15
production machines
Stretching and cutting machines
15–20 min
sensor installation
Per machine in the project
In this case study Project · Implementation · Measures · Results · FAQ
THE PROJECT
At a Glance
Industry
Expanded metal manufacturing
Machine fleet
15 machines · Built between the 1980s and 2010
Operations
Three shifts
Technology
External retrofit sensors + WatchMen
Integration
Direct ERP/BDE connection
Focus
Stroke performance, time losses, OEE and planning
THE CHALLENGE
Even running machines fell behind the plan.
Lower stroke performance, waiting times and brief interruptions accumulated over production runs that often lasted many hours. The production plan did not fully explain these deviations. The team needed to distinguish avoidable losses from targets that had to be adjusted to the material, mesh geometry or machine.
Stroke Performance
Compare actual performance and planning in the context of each order.
Time Losses
Identify waiting times, microstops and longer periods of downtime.
Shifts
Take materials, products and machines into account when comparing.
FROM MACHINE TO ANALYSIS
Retrofit. Validate. Understand.
Installing the sensors was the first step. Reliable insights came from validated machine states and the right production context.
01
Retrofit the machines
All 15 machines were connected using external retrofit sensors, without PLC access or changes to the machine controls. Installation took around 15–20 minutes per machine; according to the project report, no additional production downtime was required.
02
Connect data and context
A learning and validation phase established the data foundation. The direct ERP/BDE connection linked machine activity with order information.
03
Establish routines
Employees were trained and continuous improvement routines introduced over approximately two months. Signal validation and training were separate steps following sensor installation.
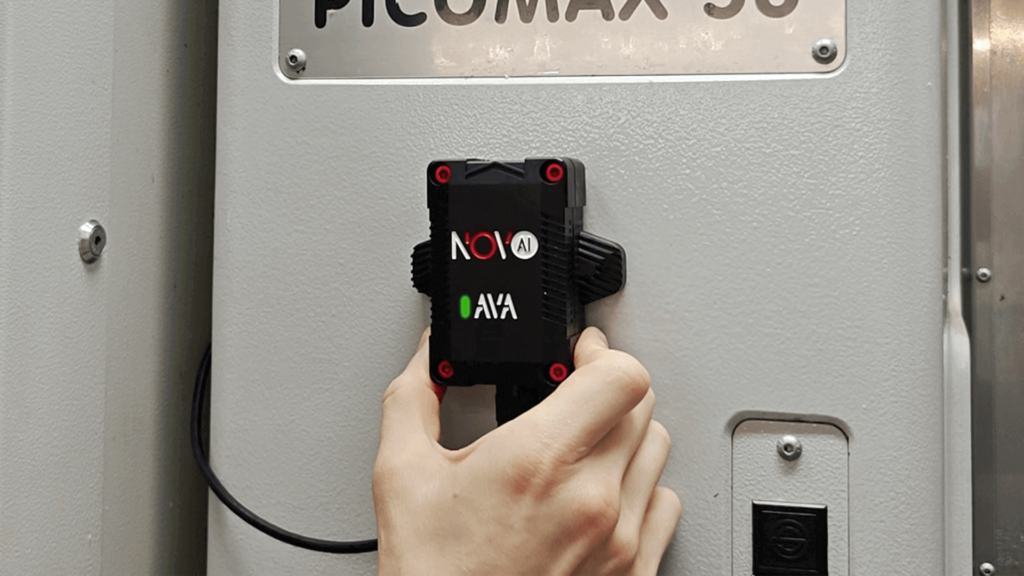
EXTERNAL SENSORS
Machine Data Without PLC Access
The sensors capture signals at the machine. WatchMen classifies the validated states; ERP/BDE data adds order information. Together, they show when losses occur and under which conditions.
TURNING DATA INTO ACTION
What the Team Changed in Daily Operations
Transparency alone does not change a process. WatchMen provided the data foundation; the production team used it to investigate causes and make targeted adjustments to workflows.
01
Investigate low stroke performance
The team compared stroke performance and machine states across shifts. Persistent deviations were investigated in the context of the respective production conditions.
02
Explain interruptions
Machine activity timelines revealed longer periods of downtime and repeated microstops. Operator feedback and BDE data supported root cause analysis.
03
Make planning more realistic
Targets were reviewed in the context of the product, material and machine. Avoidable process losses and unsuitable planning assumptions required different measures.
RESULTS IN CONTEXT
What Improved During the Project
SHARE OF NONPRODUCTIVE TIME
49.7% → 33.4%
Before · 49.7%
After 3 months · 33.4%
Scale: 0–100% of the reference time · A decrease of 16.3 percentage points.
2,823
additional machine-hours per year
Estimated annual capacity gain for the entire fleet of 15 machines.
Before and after: After three months of operational improvements, the reported share of nonproductive time fell from 49.7% to 33.4%. The difference is 16.3 percentage points. Relative to the baseline, this is approximately 32.8%.
Annual estimate: The 2,823 additional machine-hours apply to all 15 machines combined. They are not an increase in production measured over a full year and do not represent a commitment to additional saleable units.
Context: These figures relate to the project described. Starting conditions, product mix, shift model and the measures implemented affect the result. A reduction in time losses does not automatically mean an equally large increase in OEE.
GOOD TO KNOW
Questions About Stretching Machine Monitoring
Can older stretching and cutting machines also be monitored?
This project connected machines built between the 1980s and 2010. External sensors enabled monitoring without PLC access. Novo AI reviews the machines and requirements together with your team.
Does installation interrupt production?
Sensor installation took around 15–20 minutes per machine in this project and, according to the project report, required no additional production downtime. Signal validation and training followed installation as separate steps.
Which metrics does the case study cover?
The case study examines stroke performance, OEE, productive and nonproductive time, microstops and differences between shifts. It includes before-and-after results and an example calculation showing the relationship between stroke performance and order duration.
Does higher stroke performance always mean better production?
No. Achievable performance depends on the material, mesh geometry, tooling, machine and required product quality. In this project, higher stroke performance only counted as an improvement if the finished expanded metal continued to meet specifications.
Can WatchMen be connected to our ERP or BDE system?
In the expanded metal project described, order information from ERP/BDE was linked to machine activity. For your production operations, the available interfaces, machine and order identifiers, and the desired data exchange need to be reviewed. Our solution page explains the requirements for an ERP/MES connection.
What is the difference between OEE and machine utilization?
Utilization describes the use of a machine within a defined reference period. OEE combines availability, performance and quality. Machine states reveal time losses; a complete OEE calculation also requires appropriate performance and quality data.
THE COMPLETE CASE STUDY
Details to Support Your Decision
Download the English PDF with the project description, results and measurement notes.
Download the free PDF ↓APPLYING IT TO YOUR PRODUCTION
What Would You Like to Make Visible?
Tell us the number and years of manufacture of your stretching and cutting machines, typical materials and your most important question: stroke performance, interruptions or deviations from the plan? Together, we can assess which data and pilot machines would be suitable.
Discuss your application →Further reading: CNC Monitoring in Precision Tool Manufacturing · Understanding machine data acquisition: data and system boundaries · All Case Studies
Publisher: Novo AI GmbH. Source of the project information: the corresponding case study PDF. Definition and calculation: OEE based on availability, performance and quality.