Home / Case Studies / Injection Molding
CASE STUDY / PRECISION MOLD MANUFACTURING
Injection Molding Monitoring in Precision Mold Manufacturing
How can injection molding qualification machines reveal hidden capacity losses? In this project, 40 machines built between 2003 and 2017 were monitored. The customer reported a 31.13% productivity improvement, while machine-state and cycle data helped separate productive molding from setup, engineering work, waiting and recurring interruptions.
Free PDF · No registration
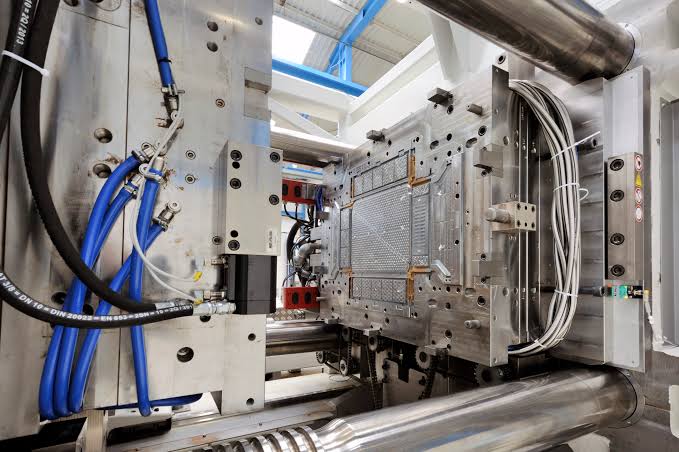
Injection molding qualification: making productive molding, setup and hidden capacity losses visible
31.13%
higher productivity
Customer-reported result
40
monitored machines
Injection molding qualification
15 min
sensor installation
Per machine in the project
In this case study Project · Implementation · Measures · Results · FAQ
THE PROJECT
At a Glance
Industry
Precision mold manufacturing
Machine fleet
40 monitored machines · Built 2003–2017
Operations
Calculation model: 2 × 8-hour shifts
Technology
External retrofit sensors + WatchMen
Integration
Direct ERP/BDE connection
Focus
Productive molding, idle time, mold changes, setup, microstops and qualification capacity
THE CHALLENGE
A Reserved Machine Can Still Hide Lost Capacity
An injection molding qualification machine may be reserved for a full day while only part of that time becomes productive molding. Setup, engineering work, waiting and technical interruptions all use machine time differently.The challenge was to distinguish necessary qualification work from avoidable time losses and understand how much of the scheduled machine time actually became productive molding.
Productive Molding
Determine how much of the scheduled qualification time actually becomes productive molding.
Setup & Changeovers
Measure mold-change and setup duration consistently across comparable qualification runs.
Interruptions
Make short stops, longer waiting periods and recurring downtime visible over time.
FROM MACHINE TO ANALYSIS
Sense. Interpret. Add Context.
Monitoring the machines was only the first step. Useful qualification analysis required validated machine states and the mold, project and quality context needed to interpret each period correctly.
01
Capture machine behavior
External sensors capture the physical behavior of the injection molding machines without requiring PLC access for the basic monitoring layer.
02
Validate states and cycles
Edge processing and validation help identify productive cycles, idle periods, setup events and recurring interruptions so that machine activity can be represented consistently.
03
Add mold and project context
WatchMen combines machine-state information with mold, project and reason data. This makes it possible to distinguish necessary engineering and validation work from avoidable production losses.
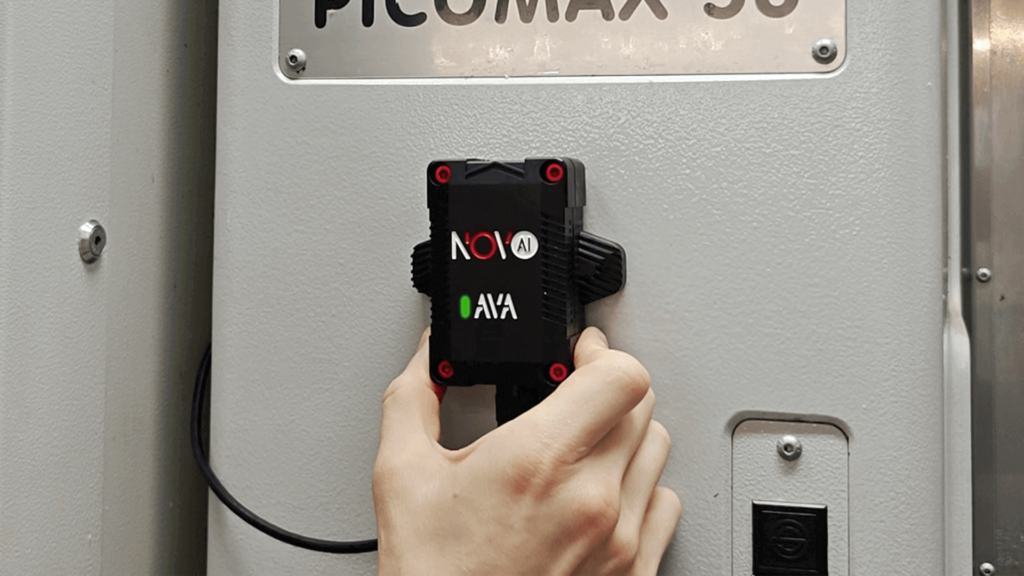
EXTERNAL SENSORS
Injection Molding Data Without PLC Access
Novo AI's external sensor approach captures physical machine behavior without requiring direct PLC access for basic monitoring. WatchMen turns the validated signals into machine states and cycle information that can be reviewed together with mold and project context.This helps production and engineering teams see when productive molding stopped, how often patterns repeated and where further investigation is required.
TURNING DATA INTO ACTION
Turn Qualification Losses Into Practical Improvements
Monitoring shows how booked machine time is actually being used. The next step is to separate necessary technical work from avoidable loss and improve the largest recurring categories.
01
Reduce hidden idle time
Review longer waiting periods around material availability, technical decisions and machine readiness. Compare equivalent qualification runs to determine whether the same idle patterns continue after improvements.
02
Prepare mold changes earlier
Review changeover and setup duration consistently. Prepare tools, parameters, utilities and other requirements before the machine becomes available so that avoidable setup waiting is reduced.
03
Make recurring interruptions actionable
Review repeated short interruptions together with material, handling and maintenance context. Keep necessary engineering, inspection and validation work separate from avoidable downtime so that the team improves the right losses.
RESULTS IN CONTEXT
What Improved During the Project
REPORTED PROJECT RESULT
−55.56%
less idle time
In the supplied operating model, idle time falls from 720 to 320 hours per machine per year. This represents a modeled reduction of 400 idle hours per machine annually.
+24,904
additional productive machine-hours per year
Calculated annual capacity scenario across the fleet of 40 monitored machines.
Reported result: The customer reported a 31.13% productivity improvement. The monitoring approach helped make productive molding, idle periods, setup, engineering activity and recurring interruptions distinguishable.
Annual capacity estimate: The modeled improvement corresponds to approximately 24,904 additional productive machine-hours per year across the monitored fleet. This represents released production capacity within the existing machine schedule rather than a full year of directly measured additional output.
Context: The 31.13% productivity improvement is the customer-reported result. Productive share, idle-time reduction, setup reduction and annual capacity are illustrative model outputs based on the supplied operating assumptions. Qualification quality and acceptance requirements remain separate constraints.
GOOD TO KNOW
Questions About Injection Molding Monitoring
Which machines were included in the case study?
The case study covers 40 monitored machines used in a precision mold manufacturing and qualification environment. The machines were built between 2003 and 2017.
What productivity improvement was reported?
The customer reported a 31.13% productivity improvement. The detailed productive-share, idle-time, setup and capacity figures on this page are modeled values used to illustrate an internally consistent machine-time scenario.
How much idle time was reduced?
In the calculation model, annual idle time falls from 720 to 320 hours per machine, which corresponds to a 55.56% reduction and 400 released hours per machine per year.
How much additional productive capacity was calculated?
The model calculates 622.6 additional productive hours per machine per year. Across all 40 monitored machines, that equals 24,904 additional productive machine-hours annually.
How did mold-change and setup time change?
In the model, mold-change and setup time falls from 480 to 336 hours per machine per year, a reduction of 30%.
Is all nonproductive time considered waste?
No. Necessary engineering, inspection and validation activities are part of the qualification process and should not automatically be treated as production losses. In the model, necessary engineering and inspection remain constant at 400 hours per machine per year.
THE COMPLETE CASE STUDY
Details to Support Your Decision
Download the English PDF with the project description, results and measurement notes.
Download the free PDF ↓APPLYING IT TO YOUR PRODUCTION
What Would You Like to Make Visible?
Tell us how many injection molding machines you operate, their approximate years of manufacture and your most important production question: productive molding time, idle time, mold changes, setup losses or recurring interruptions?
Together, we can identify suitable pilot machines and determine which machine states and qualification losses should be made visible first.
Further reading: CNC Monitoring in Precision Tool Manufacturing · Understanding machine data acquisition: data and system boundaries · All Case Studies
Publisher: Novo AI GmbH. Source of the project information: the corresponding case study PDF. Definition and calculation: OEE based on availability, performance and quality.