Home / Case Studies / Expanded Metal Manufacturing
CASE STUDY / GAS-SAFETY AND COMBUSTION-CONTROL MANUFACTURING
Gas-Safety Machine Monitoring
How can manufacturers identify where productive time is being lost across a large, mixed-age machine fleet? In this project, Novo AI WatchMen was used to monitor 118 machines built between 1998 and 2014. The customer reported a 28.5% productivity increase, while machine-state data helped make waiting, recurring stops and other production losses visible.
Free PDF · No registration
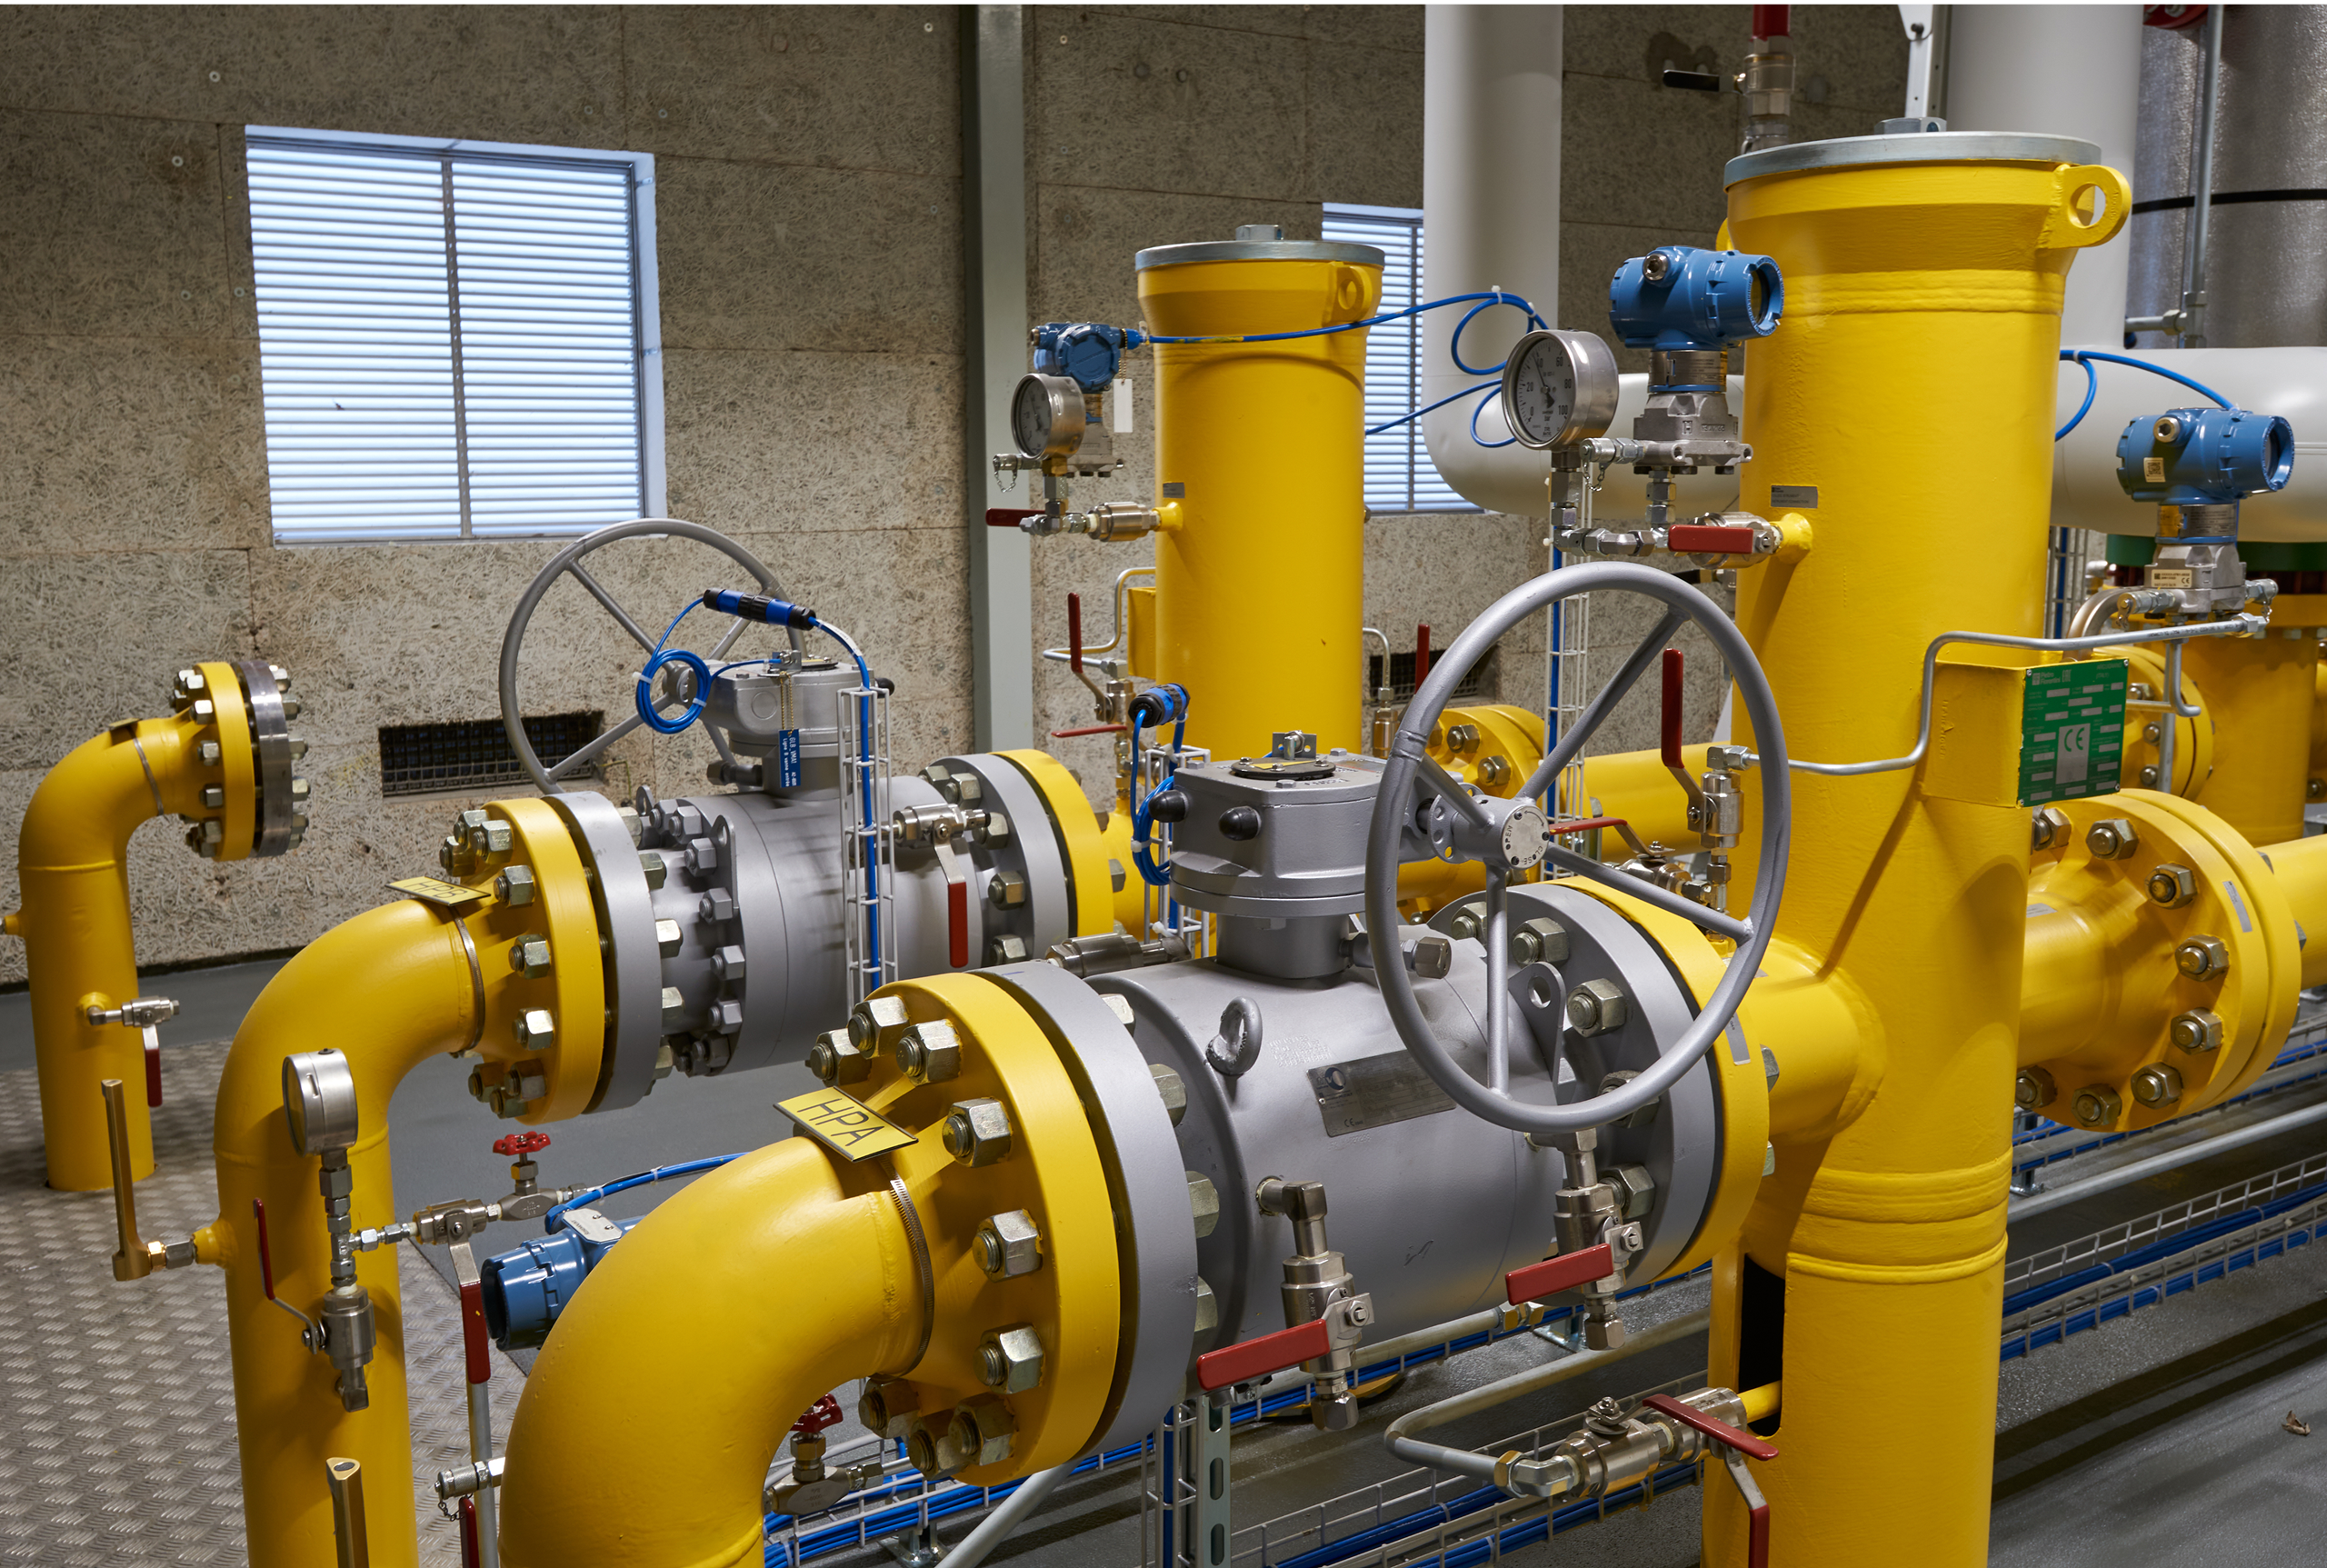
Gas-safety and combustion-control manufacturing: making productive time and recurring losses visible
+28.5%
higher productivity
Customer-reported result
118
production machines
Build years 1998–2014
15 min
sensor installation
Per machine in the project
In this case study Project · Implementation · Measures · Results · FAQ
THE PROJECT
At a Glance
Industry
Gas-safety and combustion-control manufacturing
Machine fleet
118 machines · Built between 1998 and 2014
Operations
Operating model: 3 × 8-hour shifts
Technology
External retrofit sensors + WatchMen
Integration
Direct ERP/BDE connection
Focus
Productive time, idle time, recurring stops, setup and productive capacity
THE CHALLENGE
A Machine Can Be Available While an Order Is Still Waiting
Gas-control valves, pressure-regulation parts and related components depend on both production flow and specified quality checks. Material availability, tooling, changeovers and release decisions can all affect how smoothly an order moves through production.Order records may show when work was completed, but they do not necessarily reveal every delay along the way. The production team therefore needed a clearer view of productive machine time and the gaps surrounding it.
Stroke Performance
Compare actual performance and planning in the context of each order.
Time Losses
Identify when machines are waiting for material, tooling, release or the next operation.
Shifts
Take materials, products and machines into account when comparing.
FROM MACHINE TO ANALYSIS
Retrofit. Validate. Understand.
Connecting the machines was only the first step. Useful production insights required validated machine states and the operational context needed to understand why productive time was being lost.
01
Retrofit the machines
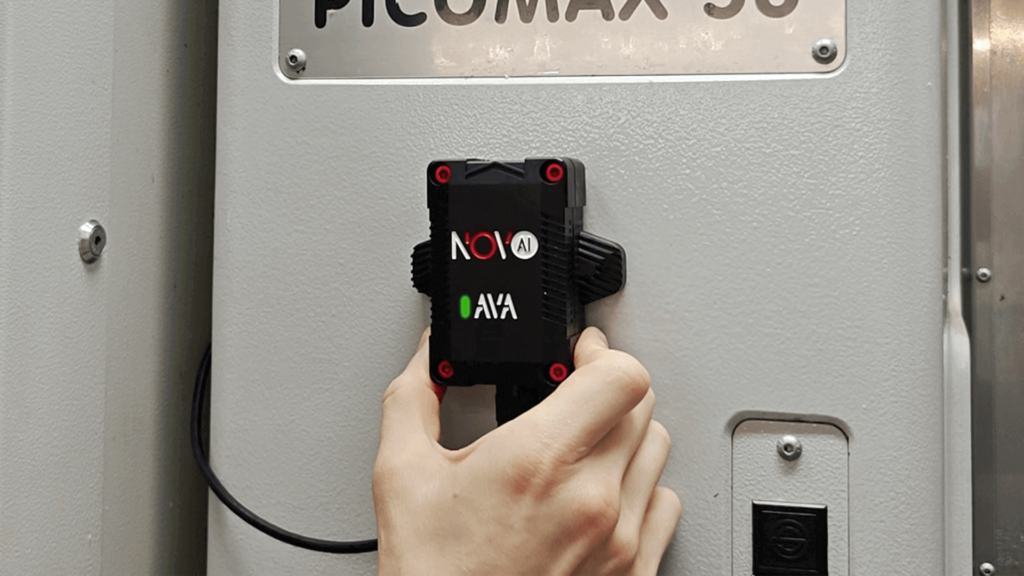
External AVA sensors were used to capture physical operating signals across a fleet of 118 machines built between 1998 and 2014. For basic monitoring, the retrofit approach does not require access to the PLC or changes to the machine control. Typical sensor installation is around 15 minutes per machine.
02
Validate signals
Acoustic and vibration signals are interpreted against actual machine operation. Productive periods, idle periods, stops and required process pauses are validated so that the timeline reflects the behavior of the respective machine and process.
03
Add order context
Machine states become more useful when reviewed together with order information, material availability, setup activity, reason labels and shop-floor knowledge. This helps the team move from identifying when time was lost to investigating why it was lost.
EXTERNAL SENSORS
Machine Data Without PLC Access
AVA sensors capture physical machine behavior, including acoustic and vibration signals. The signals are interpreted and validated against actual operation, while WatchMen provides a common machine-state timeline for analysis. Order, setup and reason information can then add production context without requiring PLC access for the basic machine-monitoring layer.
TURNING DATA INTO ACTION
What the Team Changed in Daily Operations
Transparency alone does not change a process. WatchMen provided the data foundation; the production team used it to investigate causes and make targeted adjustments to workflows.
01
Prepare the next operation earlier
Review longer idle periods to determine whether the machine is waiting for material, tooling, order release or the next process step. Use the job context to improve preparation and make unresolved readiness issues clearly actionable.
02
Improve setup and shift readiness
Use the machine timeline to review losses around changeovers and shift handovers. Separate necessary setup from avoidable waiting and make sure tools, materials and order information are ready when production needs them.
03
Investigate recurring interruptions
Repeated short stops can accumulate into significant production losses. Compare recurring events by machine, product and shift, add reason or maintenance information where available, and check whether the same interruptions decrease after corrective action.
RESULTS IN CONTEXT
What Improved During the Project
REPORTED PROJECT RESULT
−45.0%
less idle time
Modeled idle time falls from 141,600 to 77,880 machine-hours annually across 118 machines. This corresponds to 63,720 fewer idle hours per year.
+121,068
additional productive machine-hours per year
Calculated annual capacity scenario across the fleet of 118 machines. Based on the supplied operating model: 118 machines × 3 shifts × 8 hours × 250 operating days.
Reported result: The case study reports a 28.5% increase in productivity. WatchMen helped make idle periods, recurring interruptions and other production losses visible so they could be investigated systematically.
Annual calculation: In the model, productive time rises from 424,800 to 545,868 machine-hours per year, resulting in 121,068 additional productive machine-hours across the 118-machine fleet. This is a calculated capacity scenario rather than an independently measured full-year output increase.
Context: These figures relate to the project described. Starting conditions, product mix, shift model and the measures implemented affect the result. A reduction in time losses does not automatically mean an equally large increase in OEE.
GOOD TO KNOW
Questions About Gas-Safety Machine Monitoring
Can older machines also be monitored?
This project covers a machine fleet built between 1998 and 2014. Novo AI's external sensing approach allows basic machine monitoring without requiring PLC access or changes to the machine control.
How long does installation take?
Typical sensor installation in this project was approximately 15 minutes per machine. The sensor is externally installed and then its signal patterns are validated against actual machine operation.
What does the system measure?
AVA sensors capture physical behavior including acoustic and vibration signals. After validation, WatchMen can distinguish machine states such as productive operation, idle periods and stops and display how those states develop over time.
How does the system help identify why production is waiting?
Machine-state data provides the time, duration and repetition of an event. Order records, material and setup information, reason labels and shop-floor knowledge add the production context needed to investigate the cause.
Does the 121,068-hour figure represent directly measured additional production?
No. The 121,068 annual hours are calculated from the supplied operating model using 118 machines, three 8-hour shifts, 250 operating days and the reported 28.5% productivity improvement. Actual usable capacity depends on product mix, demand, downstream capacity and production conditions.
Is productive-time share the same as OEE?
No. Productive-time share describes how scheduled machine time is divided between productive and nonproductive states. OEE combines availability, performance and quality and therefore requires additional information.
THE COMPLETE CASE STUDY
Details to Support Your Decision
Download the English PDF with the project description, results and measurement notes.
Download the free PDF ↓APPLYING IT TO YOUR PRODUCTION
What Would You Like to Make Visible?
Tell us the number and years of manufacture of your stretching and cutting machines, typical materials and your most important question: stroke performance, interruptions or deviations from the plan? Together, we can assess which data and pilot machines would be suitable.
Discuss your application →Further reading: CNC Monitoring in Precision Tool Manufacturing · Understanding machine data acquisition: data and system boundaries · All Case Studies
Publisher: Novo AI GmbH. Source of the project information: the corresponding case study PDF. Definition and calculation: OEE based on availability, performance and quality.